

Real World Examples
We conclude our review of deer population dynamics with a few examples. Former MSU Deer Lab research biologist, Dr. Harry Jacobson, documented density-dependent responses of the deer herd located on Davis Island, Mississippi, in the 1970's and 1980's. This deer herd had grown to habitat's carrying capacity, and as a result the deer were in relatively poor condition. Following increased doe harvest to reduce the population (number of deaths exceeded the number of births), deer condition and corresponding deer quality characteristics responded.
In Figure 26, we see that fetal rate (average number of fetuses produced per adult doe) increased with doe harvest. When population levels began to decline more food became available which improved body condition and subsequently reproduction.
In Figure 27, we see how deer harvest improved body weight of bucks 2 years later. You may ask why is doe harvest 2-years prior related to body weight? Depending on how close the population is to carrying capacity, it may take 2 years (or longer) to lower the population enough to see meaningful change in deer condition. Additionally, it may take 2 or more years of a reduced deer population for the habitat to recover and provide enough forage to improve deer condition. The same relationship exists for deer antler size too.
Figure 28 shows the same relationship between doe harvest 2 years prior and yearling buck antler beam length. These graphs demonstrate the association between deer density and deer quality, like reproduction, body weight, and antler size. When deer density becomes excessive, all the associated deer quality characteristics will decline. In a deer management program where an objective is deer quality (like antler size and body weight), often the most effective management activity is to simply reduce deer density.
Lastly, we wanted to include an example of how random environmental events can influence a deer herd. In the previous slides we referred to a study conducted by Dr. Harry Jacobson on Davis Island, Mississippi. Davis Island is located adjacent to the Mississippi River and is prone to seasonal flooding. Sometime the flooding is minimal with little or no effect on the deer herd, and other times the height and duration of the flood will force animals off of the property and may limit their food intake.
Examine Figure 29 for the relationship between days of flooding and lactation rate of 2-year-old does. In this study, days of flooding is the number of days when ≥50% of the island was flooded. Notice that as the duration of flooding increases, lactation rate of 2-year-old does decreases.
Other interesting results from that study showed that yearling body weight decreased just as 2-year-old lactation did. However, body weight and lactation rate of older, mature does showed no relationship with flooding. This finding is consistent with the relationship depicted in Figure 18 — reproduction and survival of younger deer are the most sensitive to changes in the habitat. But the mature deer are resilient to these changes. Habitat and environmental changes will affect mature deer too, but these changes must be more severe or for a longer period of time to impact these older deer.
This concludes our review of white-tailed deer population dynamics. Deer population dynamics can be much more complicated and although the basic relationships are consistent throughout the range of white-tailed deer, the subtle relationships will vary with habitat quality and environmental pressures. In this review of white-tailed deer population dynamics we discussed the most common relationships that deer biologists study when managing a deer population. A basic understanding of these concepts is critical when making harvest management prescriptions because the interaction between the habitat, deer population numbers, and deer quality. That is, when you influence one of these variables, like deer population numbers, you will necessarily influence the other variables too.
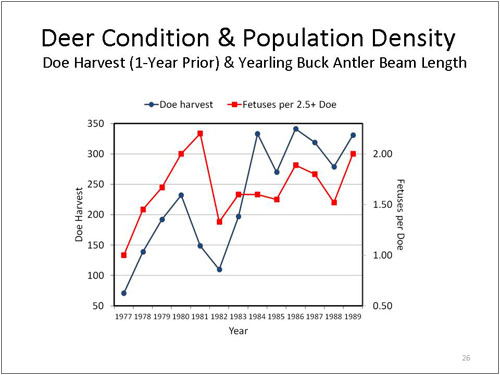
Figure 26. Deer Condition and Population Density

Figure 27. Deer Condition and Population Density
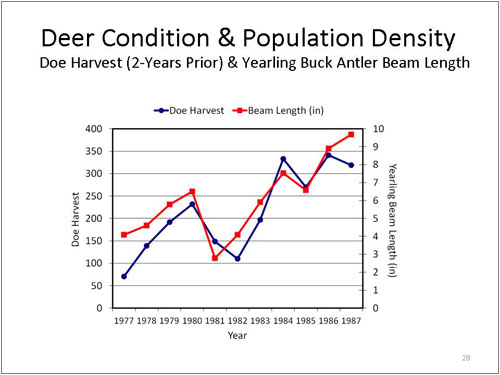
Figure 28. Deer Condition and Population Density
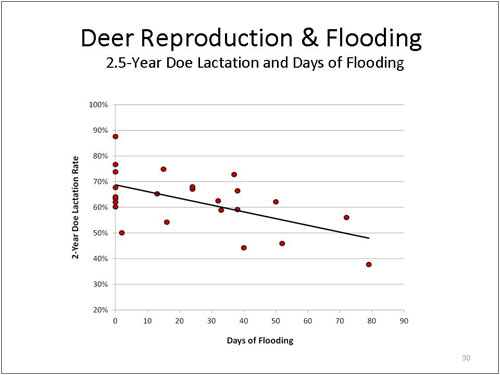
Figure 29. Deer Reproduction and Flooding