Deer Density Dependence
Now let's get into some of the nitty-gritty of density-dependent population growth. As a reminder, density dependence simply means that the deer population growth rate is influenced by deer density. Refer to How does the population growth rate change with deer population size? for a diagram showing the relationship, or feedback system, between deer population growth and population density.
As population density increases the amount of deer food in the area declines; this decline in food affects deer body condition. Body condition serves as a physiological indicator to the reproductive system, so when body condition is good, reproduction is high; when body condition is poor, reproduction is low. Reproduction also influences body condition (note the 2-way arrow between body condition and reproduction in Figure 13).
This is because producing and nursing fawns is very physiologically demanding to a female. Additionally, bucks can lose up to 25% of their body weight during the breeding season. If the deer population is close to carrying capacity, which causes habitat quality to be low, the effects of reproduction can be much more pronounced at high deer densities versus low deer densities.
Lastly, and most intuitively, the reproductive rate (or fawns produced per adult doe) will be lower when deer densities are greatest. This deer density-body condition-reproduction feedback loop is the heart of the density dependence system in white-tailed deer.
How does the population growth rate change with deer population size? Part I.
What does this mean in terms of numbers — how does the population growth rate change with deer population size?
Notice from Figure 14 that deer population growth rate declines with increasing deer numbers. This is because deer select the most palatable and nutritious forages (they taste good, are very digestible, and are packed with nutrients) first and then select less palatable and less digestible forages next. Think of how we select food at the buffet — we go for the tastiest foods first, but when those foods become unavailable (because everyone else is choosing those foods too) we then select the next favorite food. A similar pattern occurs with deer. Unfortunately, the best forages for deer are typically found in the least amount, so those foods are selected and consumed very quickly.
A good example in the southeastern U.S. is strawberry bush (Euonymus americana), this perennial shrub is commonly absent from most forests because it is so desirable to deer, and can serve as a good indicator of deer density. That is, if strawberry bush is frequently found on the property you hunt or manage, the deer density is likely below 50% of the habitat's carrying capacity.
So deer have 1st choice plants, 2nd choice plants, 3rd choice plants and so on. Deer biologists commonly use the presence/absence of these plants, or the extent of browsing on these plants, as indicators of deer density on a property. As deer populations move through the ordered progression of these plants they get less and less protein and energy in return. Less nutrition is manifested in decreased body condition, and as we learned earlier, decreased body condition lowers reproductive output (less fawns produced per adult doe). So referring back to Figure 14 we see that as population size increases, the population growth rate decreases.
Biologists commonly use the relationship depicted in Figure 14 as the underlying theoretical relationship between deer density and population growth rate. This is called a linear (straight line) relationship because as population density increases by one unit the population growth rate declines by one unit. There was evidence for this relationship at the George Reserve when Dr. Dale McCullough applied these mathematical relationships to that deer herd. Furthermore, using a linear relationship makes the mathematics easier ("easier mathematics" is relative term!).
How does the population growth rate change with deer population size? Part II.
Many biologists believe the underlying relationship is not linear, but is curvilinear. That is, the relationship follows a curve rather than a straight line (Figure 15). What this means is that deer density can increase for some period of time and deer population growth rate will not decline, but this all depends on habitat quality.
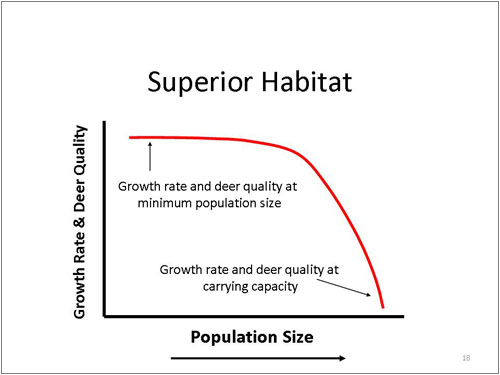
When you consider habitat quality, different relationships are possible for poor habitat quality (Figure 16), moderate habitat quality (Figure 17) and superior habitat quality (Figure 18).
These are all based on the abundance of "1st choice" plants. In poor habitat, 1st choice foods are rare and are consumed at low deer densities which causes body condition and population growth rate to decline. Conversely, in superior habitat 1st choice foods are abundant and the population can grow to great numbers before those foods are completely consumed.
There is one really important point to keep in mind — although the population growth rate declines when these 1st choice foods are depleted, the population can still increase. Figure 19 shows this concept, but how does this work?
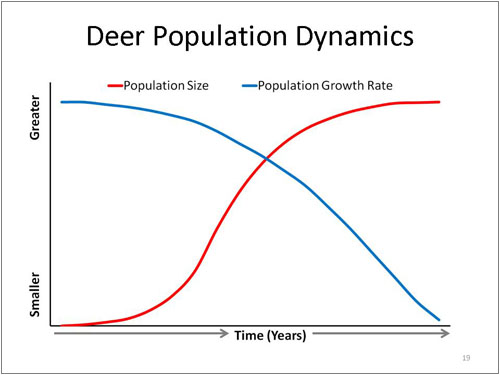
If growth rate is declining, wouldn't population size decline as well? Not exactly. Remember that population growth rate is just that — a rate. So even though the average reproductive rate for does is declining, there are more adult does on the property giving birth to fawns, which causes the population size to increase. For example, if you had 10 does on a property each producing 2 fawns you would have 30 deer the following winter (10 does plus the 20 fawns). On the other hand, if you had 30 does and each produced only 1 fawn you would have 40 deer the following winter (30 does plus 10 fawns).
So the population can continue to grow even with a decreasing growth rate. Only when the adult survival rate declines along with a low reproductive rate do you see the actual population size decline. Or stated another way, when the number of outputs (deer deaths) exceeds the inputs (deer births) do you see a population decline. This is what happens when a harvest rate is applied to a deer herd with the goal of lowering the population size — the number of deaths exceeds the number of births (assuming immigration and emigration are equal).
This concept is very important to understand if you are managing a property for the maximum number of deer to harvest annually. Biologists call this "maximum sustained yield" (Figure 20).
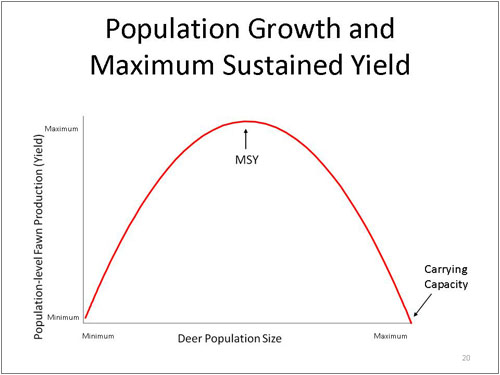
Maximum sustained yield, or MSY, is attained when population-level reproduction is the greatest. Or stated another way, MSY is the point where the deer population produces the greatest number of fawns. Fawn production of individual does is below their maximum capability, but at MSY there are more adult does to produce fawns which results in more fawns being produced at the population level.
The shape of this curve and point where MSY occurs likely depends on habitat quality and stability of habitat (no drastic swings in habitat due to temperature and rainfall). In typical white-tailed deer habitat found in the southeastern U.S., MSY probably occurs somewhere between 50 and 60% of carrying capacity.
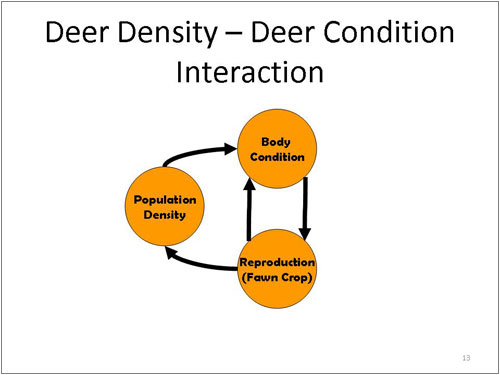
Figure 13. Deer Density - Deer Condition Interaction
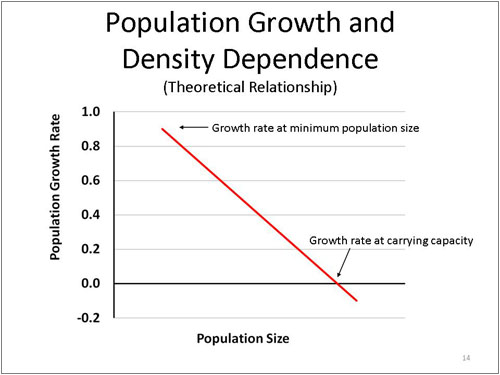
Figure 14. Population Growth and Density Dependence
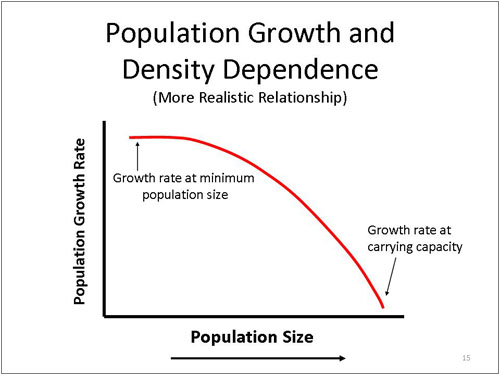
Figure 15. Population Growth and Density Dependence - More Realistic Relationship
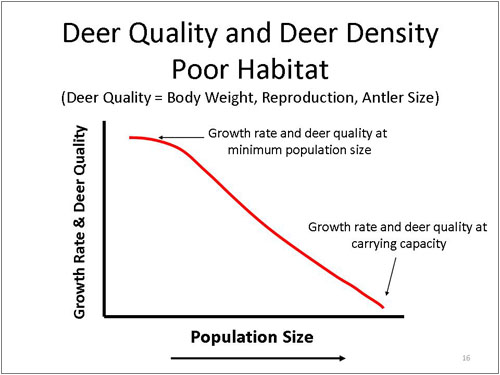
Figure 16. Deer Quality and Deer Density Poor Habitat
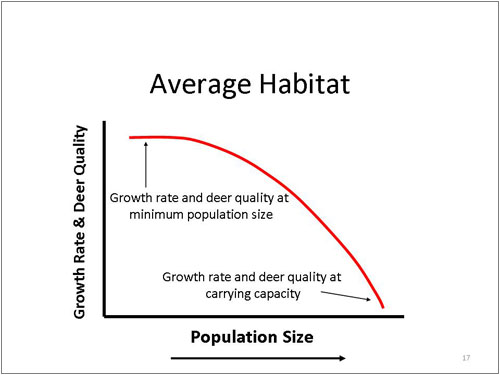
Figure 17. Deer Quality and Deer Density Average Habitat